Note
Go to the end to download the full example code.
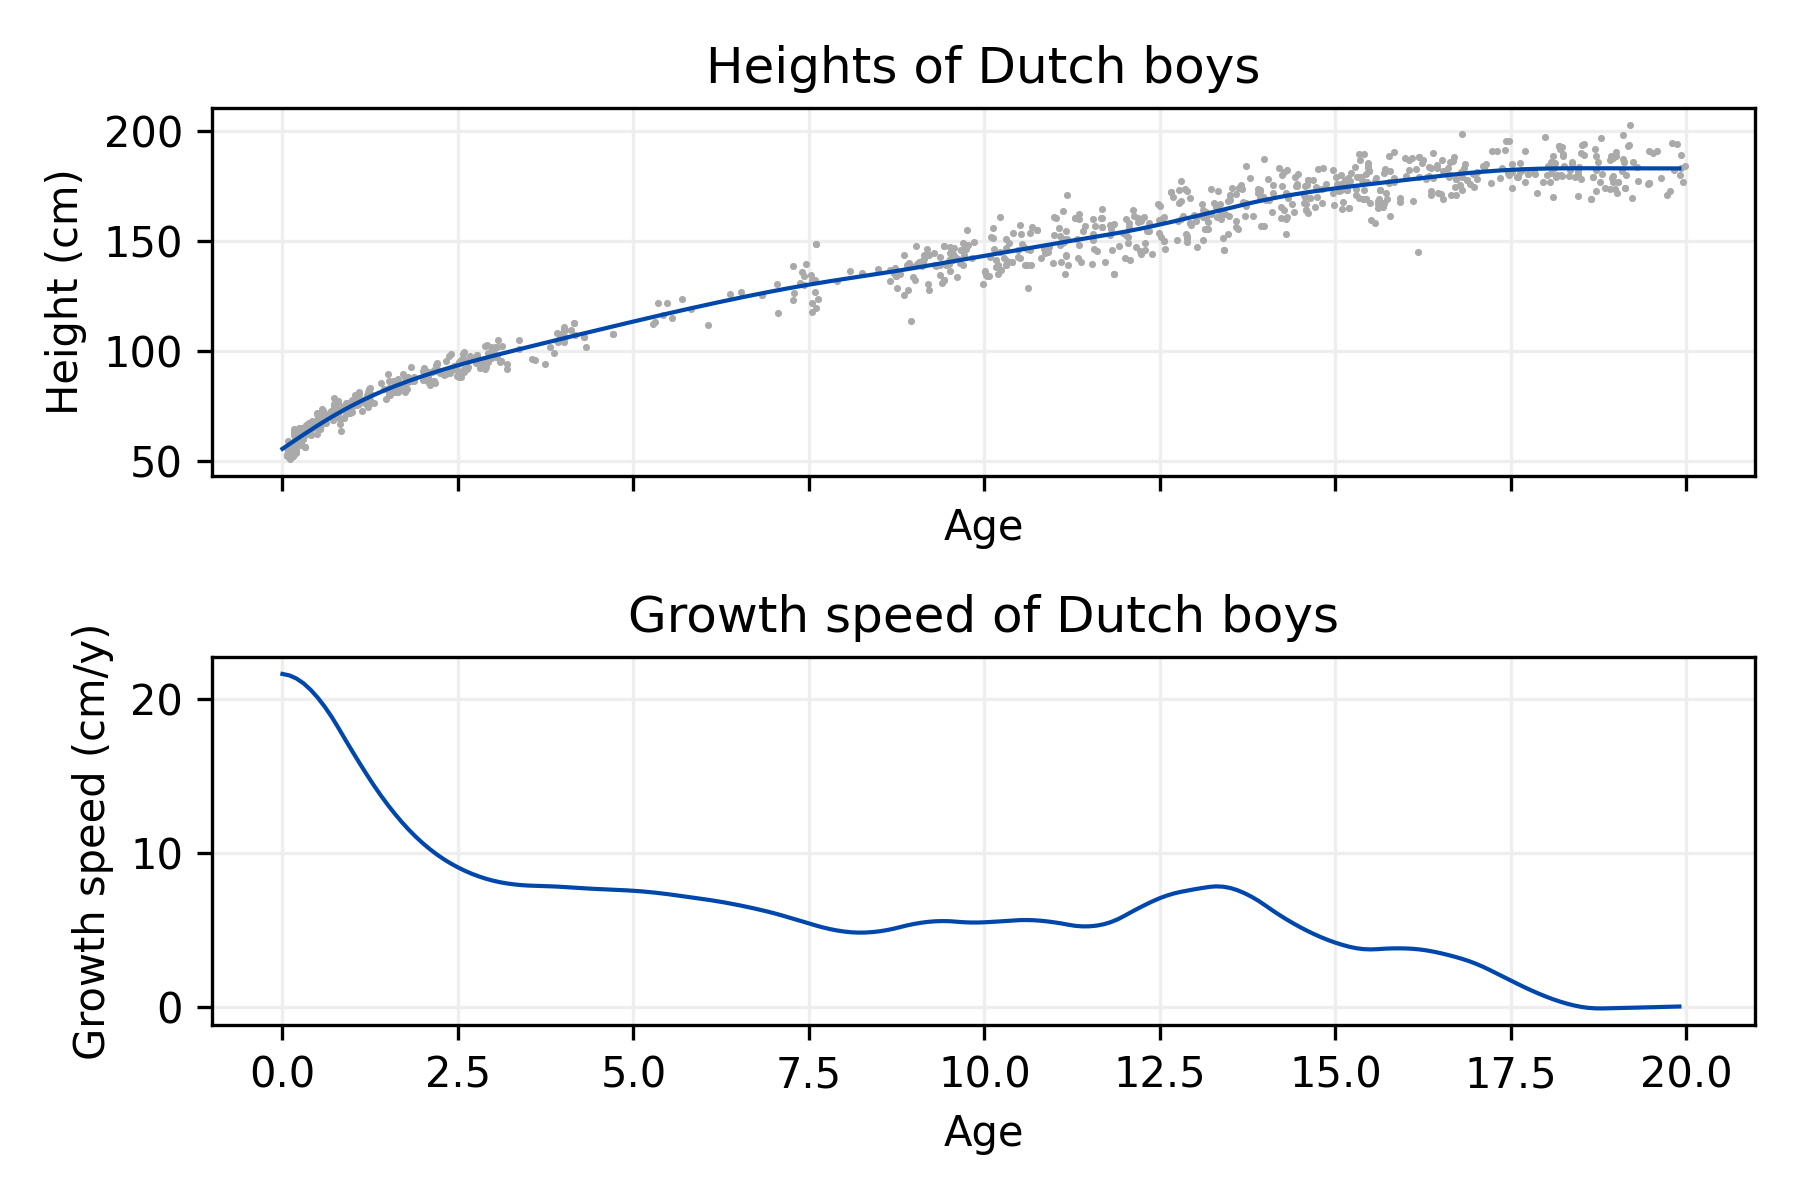
Smoothing of BMI and its derivative against age (boys7482 data)#
import numpy as np
import matplotlib.pyplot as plt
import pandas as pd

from pyspline.psplines import PSplines


# Set RNG
rng = np.random.default_rng(42)


# Get the data
data = pd.read_csv("../data/boys7482.csv")
data = data.query("age < 20").dropna(subset=["age", "hgt"])
age = data["age"].to_numpy()
height = data["hgt"].to_numpy()


# Subset the data
mask = rng.choice(age.shape[0], 1000)
age = age[mask]
height = height[mask]


# Fit the model
ps = PSplines(n_segments=(50,), degree=(3,), penalty=(100,), order_penalty=2)
ps.fit(age.reshape(-1, 1), height, domains=(0, 20))

new_age = np.arange(0, 20, 0.1)
new_height = ps.predict(new_age.reshape(-1, 1))


# Estimate the derivative
height_deriv = ps.derivative(new_age.reshape(-1, 1), order_derivative=1)


# Build the graph
fig = plt.figure(figsize=(6, 4), dpi=300)
axs = fig.subplots(2, 1, sharex=True)

axs[0].scatter(age, height, color="#AAAAAA", s=0.5, zorder=3)
axs[0].plot(new_age, new_height, color="#0047AB", linewidth=1, zorder=4)
axs[0].grid(linestyle="-", color="#EEEEEE", zorder=0)
axs[0].set_xlabel("Age")
axs[0].set_ylabel("Height (cm)")
axs[0].set_title("Heights of Dutch boys")

axs[1].plot(new_age, height_deriv, color="#0047AB", linewidth=1, zorder=4)
axs[1].grid(linestyle="-", color="#EEEEEE", zorder=0)
axs[1].set_xlabel("Age")
axs[1].set_ylabel("Growth speed (cm/y)")
axs[1].set_title("Growth speed of Dutch boys")

plt.tight_layout()
plt.show()
Total running time of the script: (0 minutes 0.662 seconds)