Note
Go to the end to download the full example code.
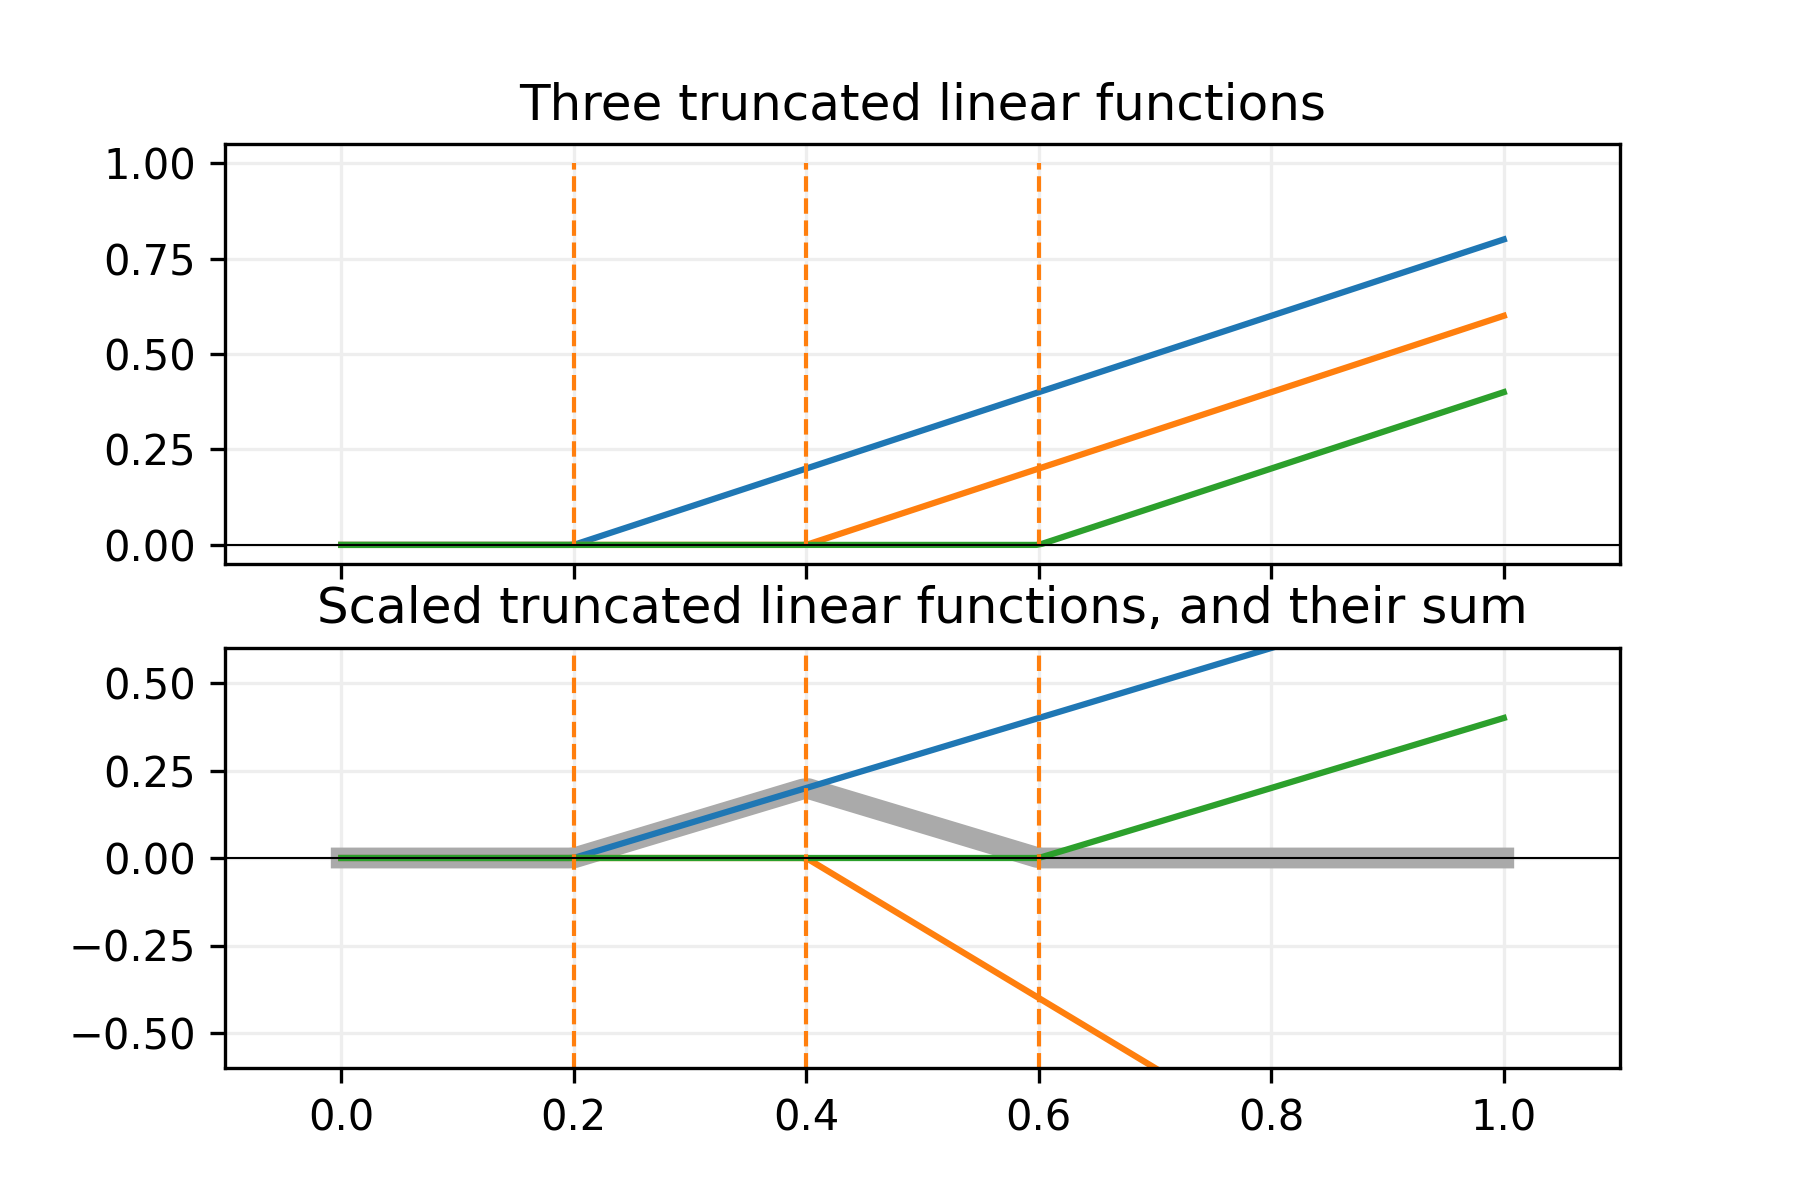
Construction of linear B-splines from truncated power basis#
import numpy as np
import matplotlib.pyplot as plt


# Compute the truncated linear functions
m = 200
u = np.linspace(0, 1, m)
knt = np.array([0.2, 0.4, 0.6])
n = knt.shape[0]
U = np.outer(u, np.repeat(1, n))
K = np.outer(np.repeat(1, m), knt)
P = (U - K) * (U > K)


# Partial sums
f0 = P[:, 0]
f1 = P[:, 1]
f2 = P[:, 2]


# Build the graph
fig = plt.figure(figsize=(6, 4), dpi=300)
axs = fig.subplots(2, 1, sharex=True)

axs[0].plot(u, P)
axs[0].vlines(
    knt, ymin=0, ymax=1, color="tab:orange", linestyle="dashed", linewidth=1
)
axs[0].hlines(0, xmin=-0.2, xmax=1.2, color="#000000", linewidth=0.5)
axs[0].grid(linestyle="-", color="#EEEEEE", zorder=0)
axs[0].set_title("Three truncated linear functions")
axs[0].set_xlim((-0.1, 1.1))

axs[1].plot(u, f0 - 2 * f1 + f2, color="#AAAAAA", linewidth=5)
axs[1].plot(u, f0)
axs[1].plot(u, -2 * f1)
axs[1].plot(u, f2)
axs[1].vlines(
    knt, ymin=-1, ymax=1, color="tab:orange", linestyle="dashed", linewidth=1
)
axs[1].hlines(0, xmin=-0.2, xmax=1.2, color="#000000", linewidth=0.5)
axs[1].grid(linestyle="-", color="#EEEEEE", zorder=0)
axs[1].set_title("Scaled truncated linear functions, and their sum")
axs[1].set_xlim((-0.1, 1.1))
axs[1].set_ylim((-0.6, 0.6))

plt.show()
Total running time of the script: (0 minutes 0.260 seconds)