Note
Go to the end to download the full example code.
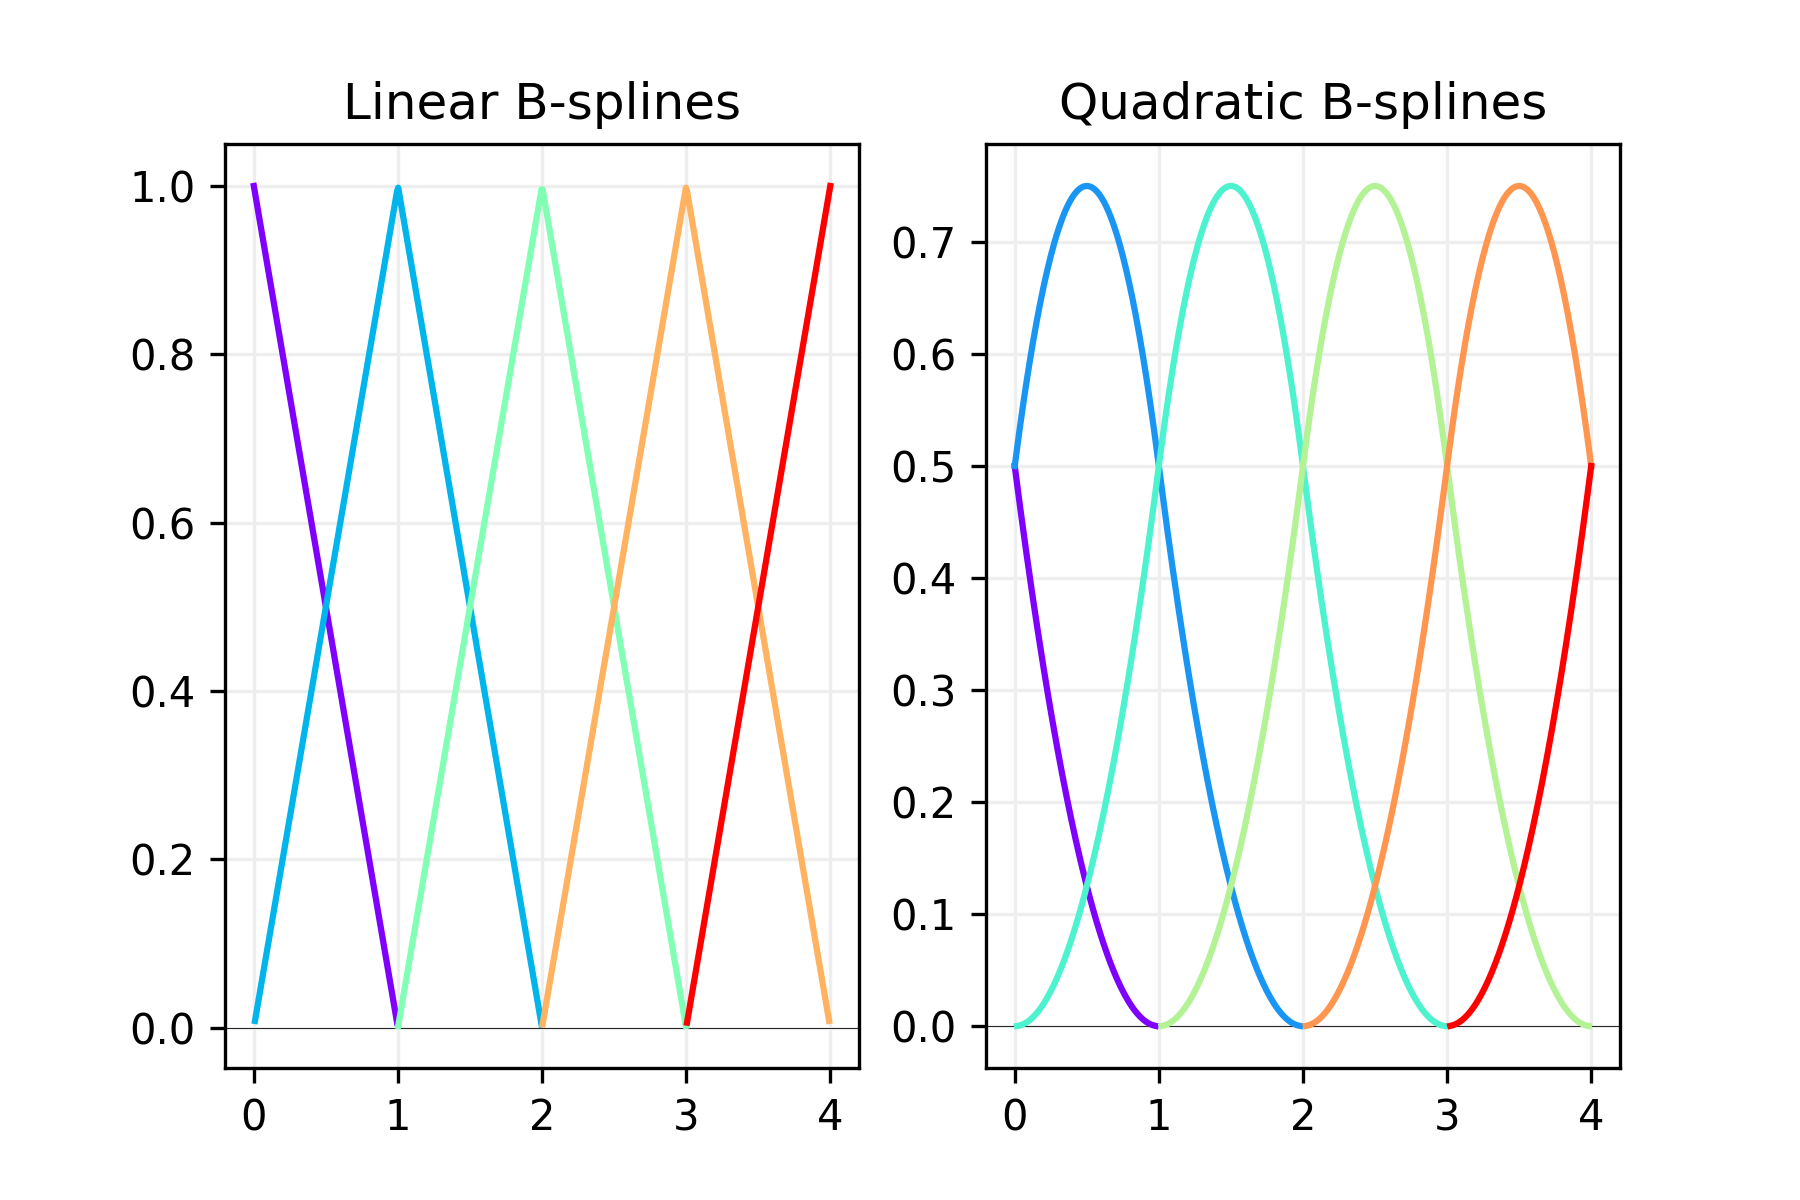
Illustration of linear and quadratic B-spline bases#
import numpy as np
import matplotlib.pyplot as plt
import matplotlib.cm as cm

from pyspline.basis import basis_bsplines


# Basis on grid
ndx1 = 5
ndx2 = 6
deg1 = 1
deg2 = 2
ng = 500
xmin = 0
xmax = 4
xg = np.linspace(xmin, xmax, ng)
Bg1 = basis_bsplines(
    xg, n_functions=ndx1, degree=deg1, domain_min=xmin, domain_max=xmax
)
Bg2 = basis_bsplines(
    xg, n_functions=ndx2, degree=deg2, domain_min=xmin, domain_max=xmax
)


# For plotting
Bg1[Bg1 < 1e-4] = np.nan
Bg2[Bg2 < 1e-4] = np.nan


# Build the graphs
fig = plt.figure(figsize=(6, 4), dpi=300)
axs = fig.subplots(1, 2, sharex=True)

colors = iter(cm.rainbow(np.linspace(0, 1, ndx1)))
for idx in np.arange(ndx1):
    c = next(colors)
    axs[0].plot(xg, Bg1[idx].T, color=c, zorder=4)

colors = iter(cm.rainbow(np.linspace(0, 1, ndx2)))
for idx in np.arange(ndx2):
    c = next(colors)
    axs[1].plot(xg, Bg2[idx].T, color=c, zorder=4)

axs[0].axhline(y=0, color="k", linewidth=0.2, zorder=3)
axs[0].set_title("Linear B-splines")
axs[0].grid(linestyle="-", color="#EEEEEE", zorder=0)

axs[1].axhline(y=0, color="k", linewidth=0.2, zorder=3)
axs[1].set_title("Quadratic B-splines")
axs[1].grid(linestyle="-", color="#EEEEEE", zorder=0)

plt.show()
Total running time of the script: (0 minutes 0.250 seconds)